The Stock Cycles Forecast newletter has been continuously published since 1985 and has one of the very best track records in the history of the business. Spectacular market calls like the precise calling of the 1987 top to the day and the October crash in 1987 with the comments of "an immediate crash"... expecting a point drop in the Dow Jones of over 500 points,"to bottom near October 19th" are just a sampling of the precise and accurate information you will have with each publication. While the newsletter itself is published every three weeks, there is a nightly telephone update that gives a detailed forecast for the following day with expected support and resistance numbers, hourly turning points within the day and specific recommendations on a good dozen stocks, ETF's and a general commentary on what the professionals see happening in the market over the next several days. Many newsletters predict the outlook for the general market but since Mr. Jenkins background is that of a professional day trader he gives many individual stock recommendations that often achieve spectacular gains. You may be aware of Mr. Jenkins highly regarded personal private lessons for $5,000 that reveal many of the lost Gann secrets, but in the letter you will get access to a program that Mr. Jenkins wrote to mechanicaly calculate these major cyclic turns for individual stocks. These important cycle turns are listed in a table in each issue and a very large percentage of them make dramatic turns on the precise day indicated. Option traders love this feature since stocks often move $3 to $5 within only a few days of these indicated turns. For example the reproduction below is the actual table from the December 16th 2005 newsletter. Circled are just a few of the expected turns due during that time period.

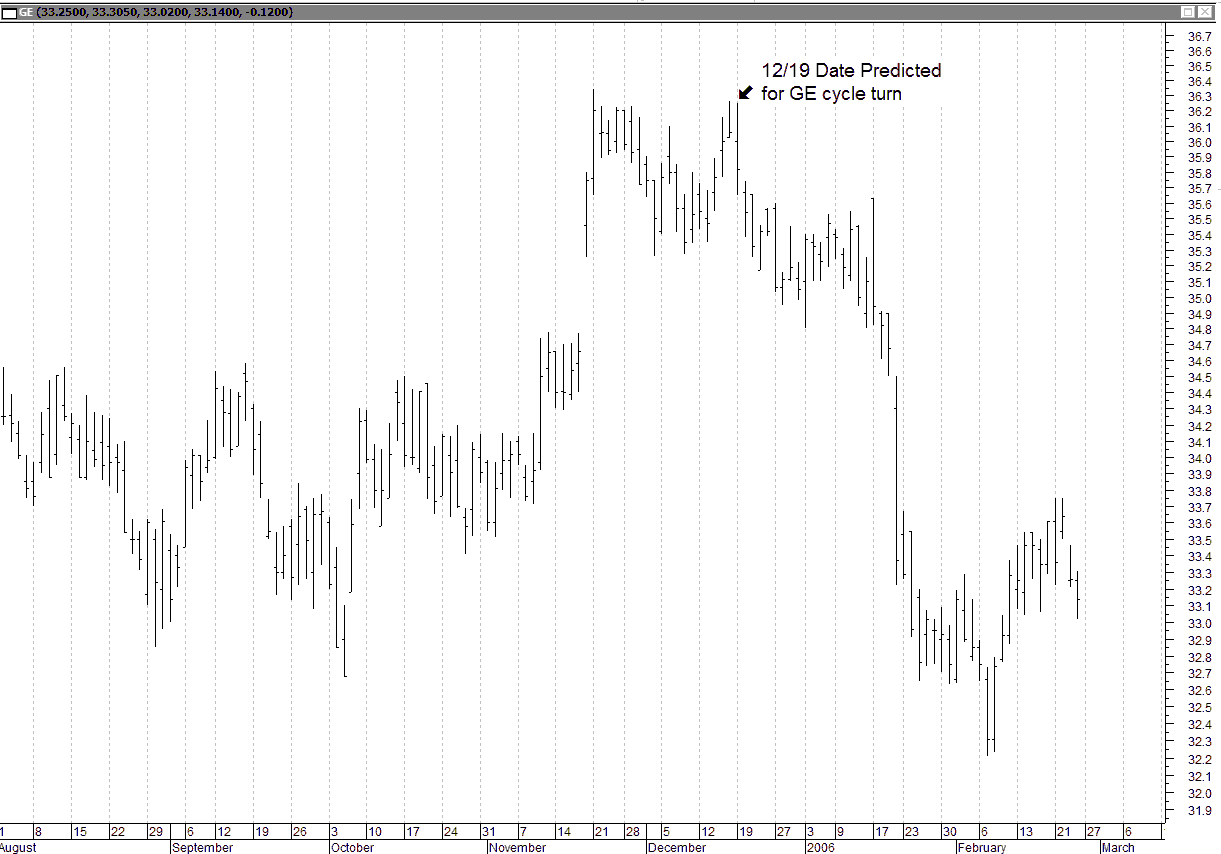
Note the symbol for GE and a turn indicated for 12/19 or December 19th. The chart below shows what happened to GE on that date which was given to you several days ahead of time, in some cases three weeks to a few months ahead of time so you will be prepared for a great trading opportunity.
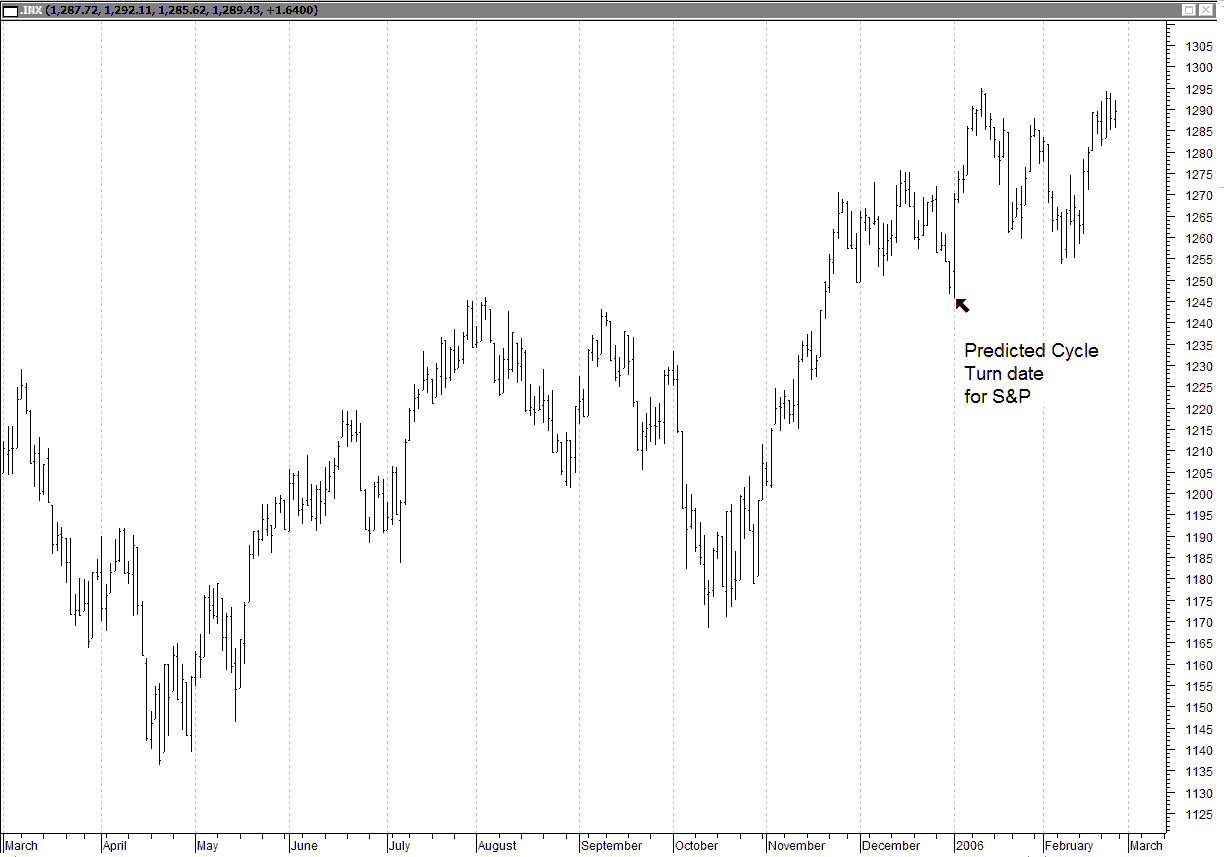
What if you don't like to trade stocks? How about the market averages using futures, or ETF's or options? Note the table shows that the S&P 500 Index will make a big turn on or about January 3rd, 2006 (remember this forecast was given on December 16th). The chart below shows what happened to the S&P on January 3rd. Could you have made money with that information? How about getting rich!
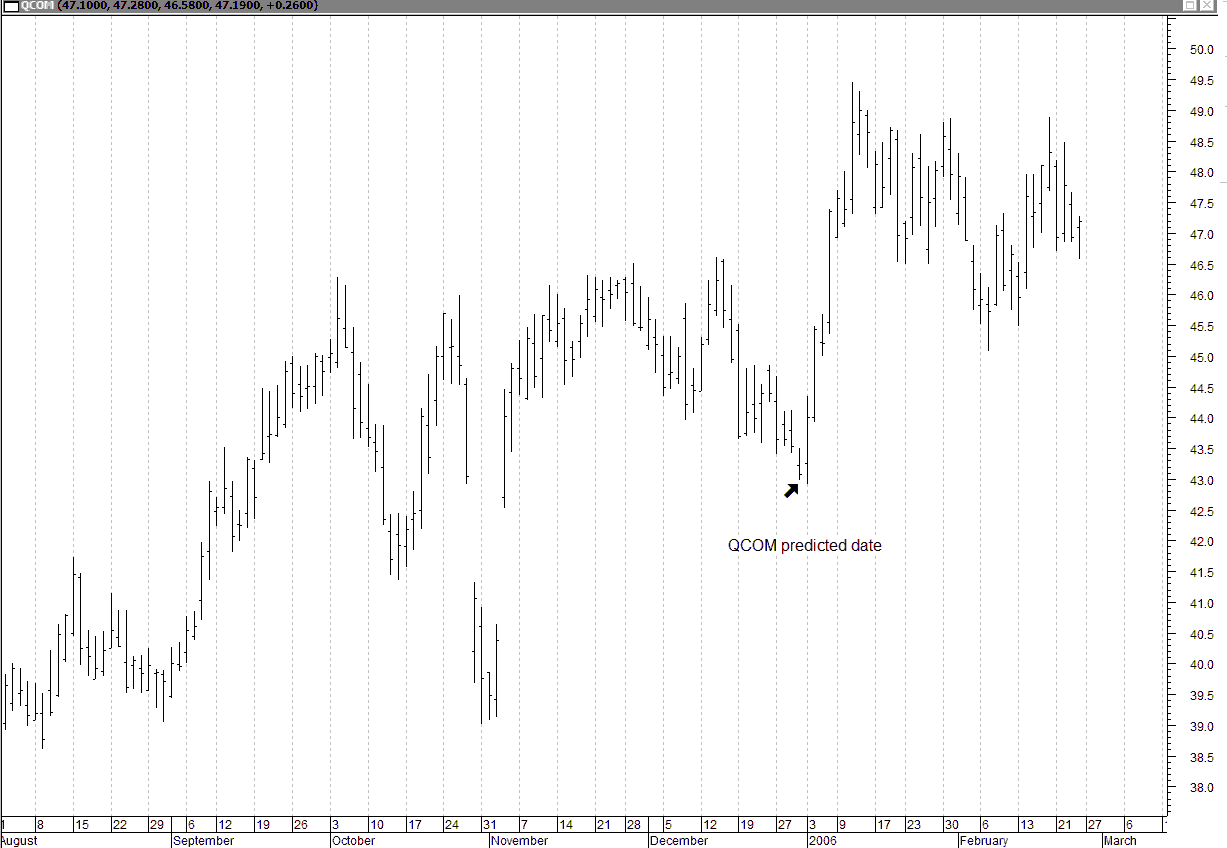
Previously we saw the charts of GE and the S&P and noticed that GE went down and the S&P went up. This is typical of market rotational leadership and you can't simply buy a basket of stocks and expect them all to go up or down. Cycle information is a huge help here. Lets look at the chart of Qualcomm that was indicated for a big cyclic turn on or about December 30th. The chart below shows a clear low with another bullish upleg to lead the market higher.
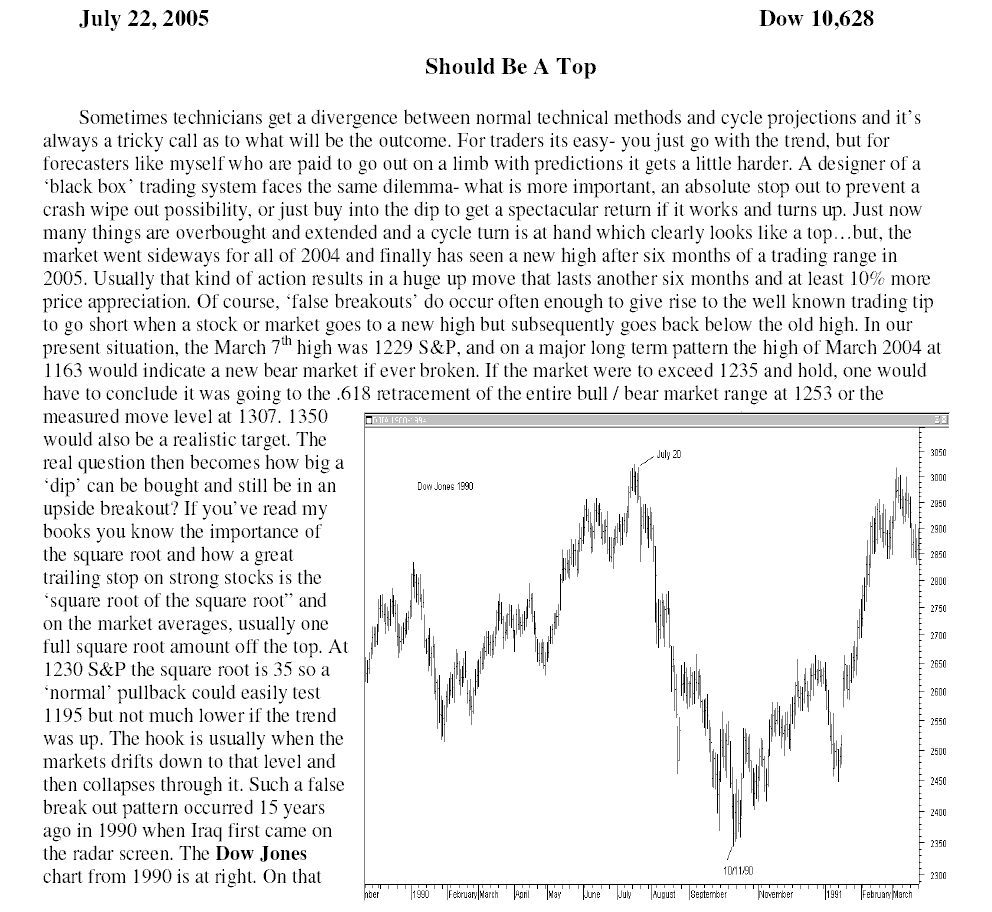
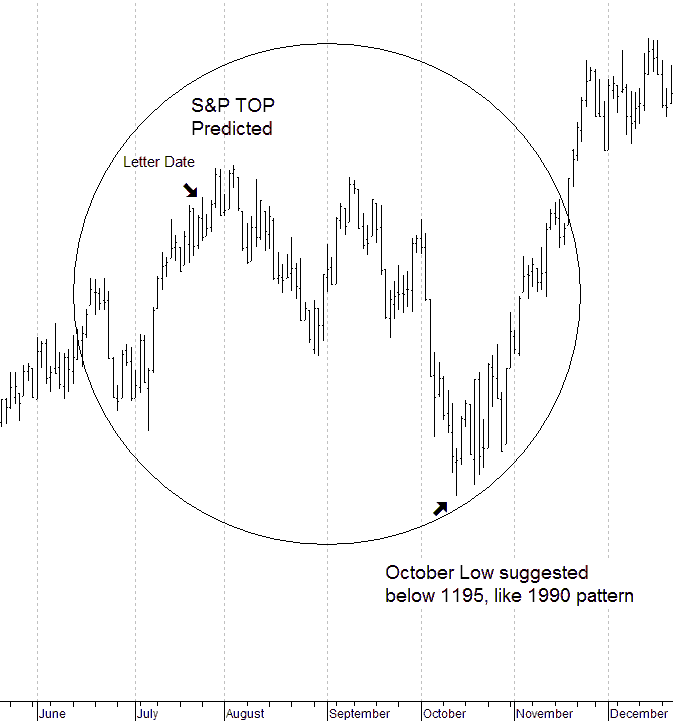
These few examples shown above are typical of what is found in each issue but the real value is in the body of the newsletter which gives the main forecast and the target prices, and what if anything could be wrong with the forecast. This next picture below is the cover page from the July 22,2005 issue which suggests that the market is repeating a 15 year cycle from 1990 and a major high would be seen at the end of July and a decent correction down into October 10th could be expected. This is a specific forecast of a two to three month decline of 5%-7%.
This chart is the actual outcome of that July prediction- the top came in as expected although it lingered at the highs until August 3rd and then the low came in on October 13th near 1168.
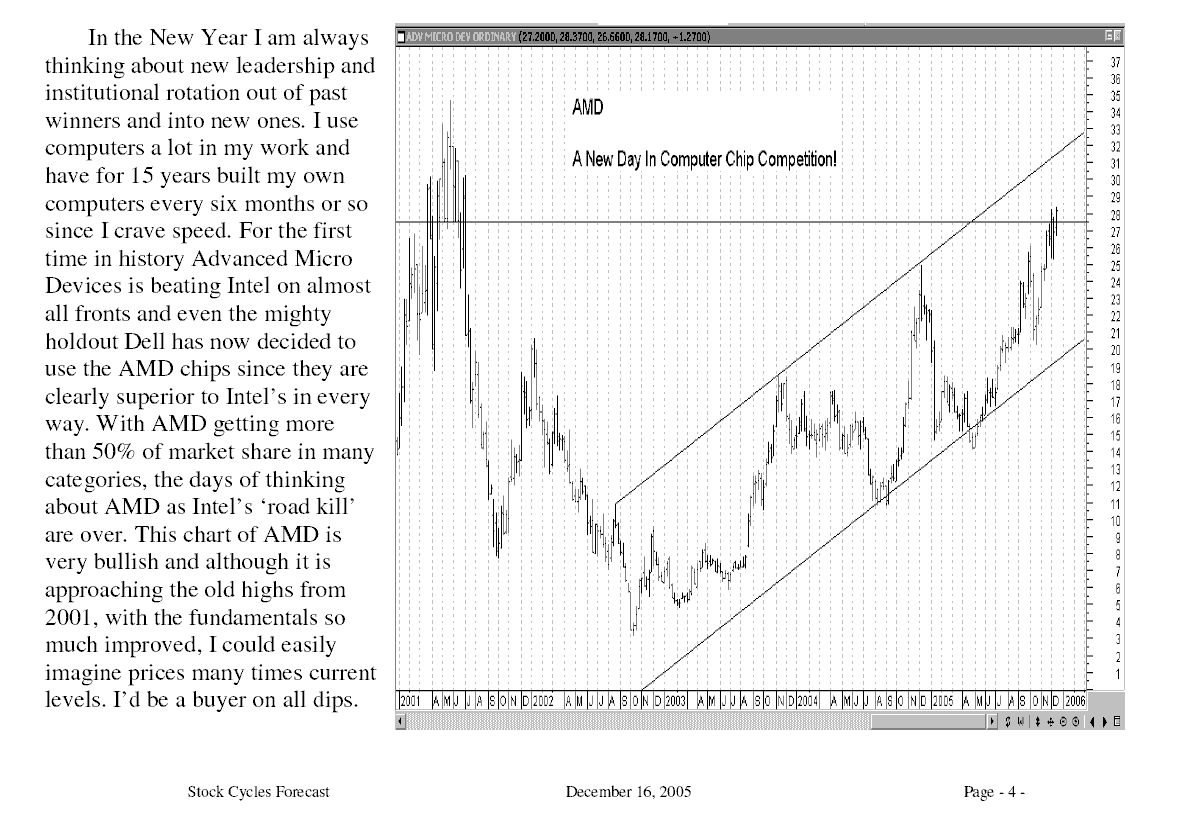
Along with the table listings in the newsletter showing various cyclic turning points for individual stocks, the major body of the newsletter report highlights stocks of interest due to major cyclical influences occuring during that time period. Many stocks are featured in each issue and these are considered 'core holdings' either long or short as the case may be. These featured stocks often greatly outperform the general market and serve as a good tape reading proxy for those trying to follow the market day to day by watching how these stocks react. Below is one such comment on the major change in the trading habits and fundamentals of Advanced Micro Devices and the resulting expected outcome which is still being played out.
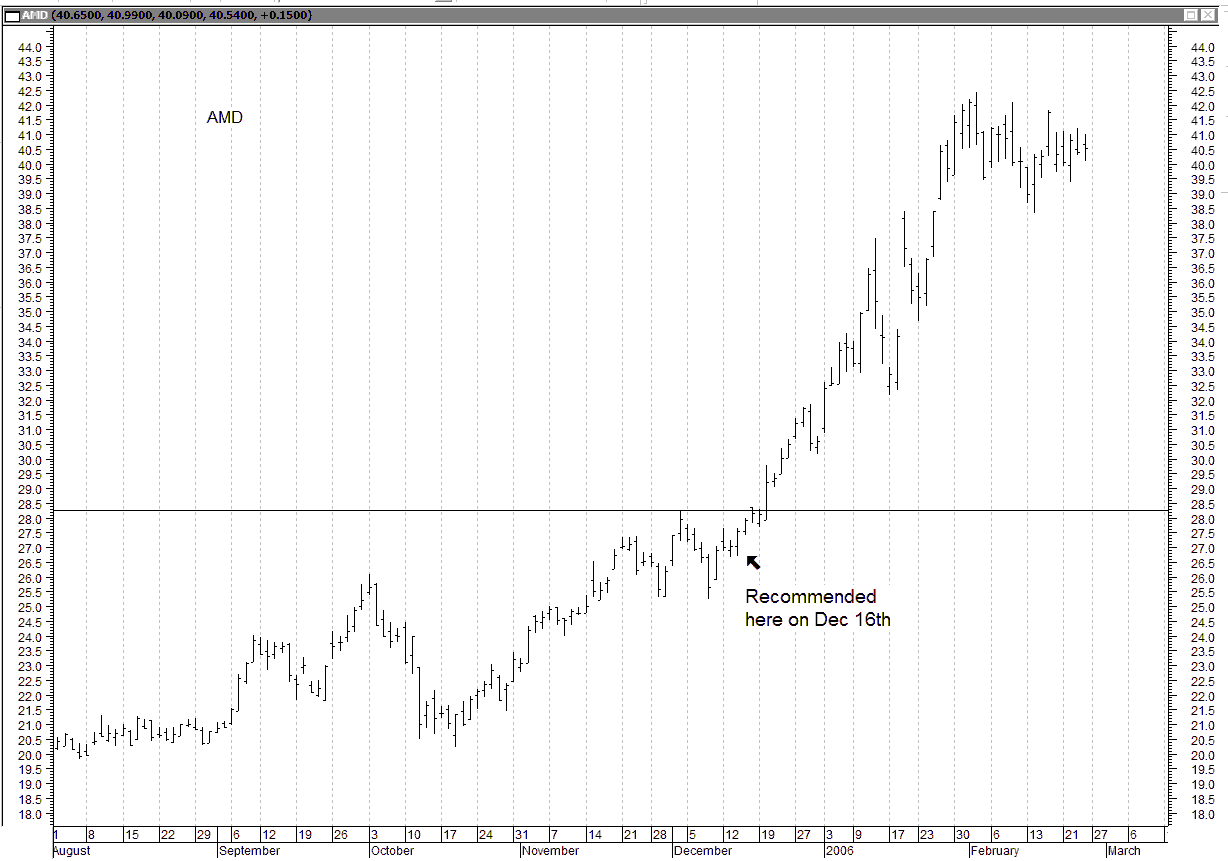
This next chart shows the following two months of Advanced Micro Devices and how the recommendation near a price of $27 quickly turned into a $42 winner and is only just now being recommended by a number of new brokerage firms after such a great run.
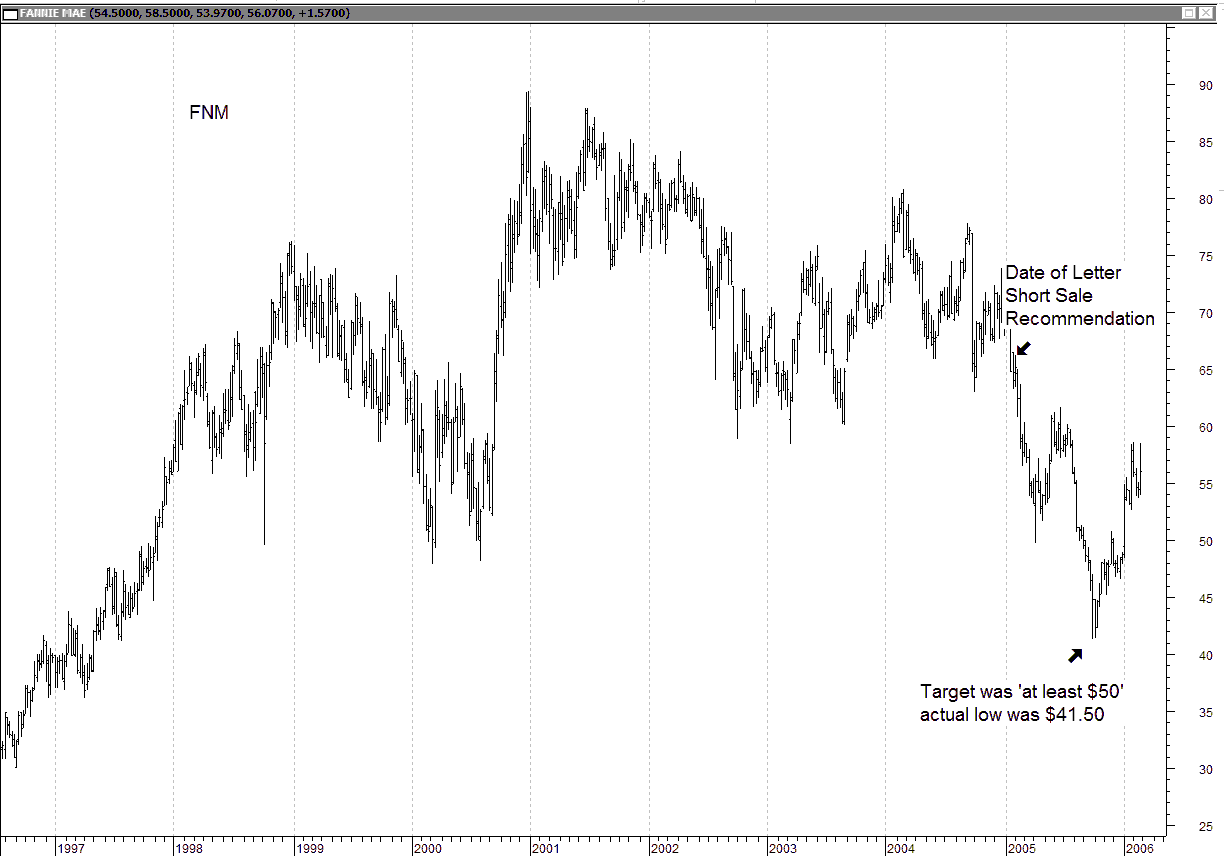
Depending on the cycle the general market is in, I will often recommend short sales or just liquidations of bad long positions you should avoid. Federal National Mortgage was one of those in 2004 and 2005 that I felt would be going down for a number of years because a new bear market was due to start in this stock due to its cyclic characteristics. The report below from February 2005 shows one such critical time period where an opportunistic short presented itself to my readers.
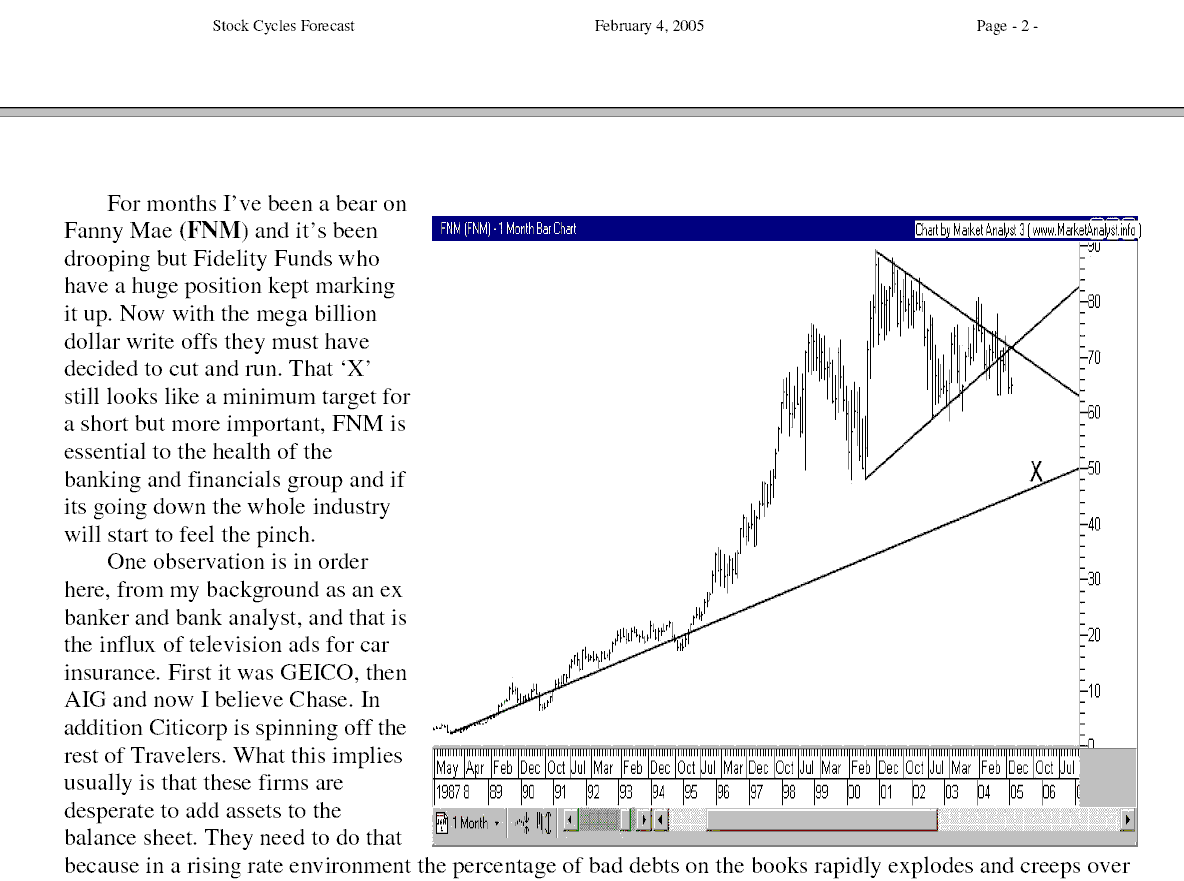
Here is the outcome of that short recommendation. Note how when you sell short it is imperative that your timing is excellent since short trades are just scalping techniques to get a few points in a bear trend and are not of a long term 'investment' nature as in a buy and hold purchase. Trading stocks without a good timing methodolgy can cost you a lot of money. The very reasonable cost of my letter with nightly hotwire can often pay for itself the very first day several times over.
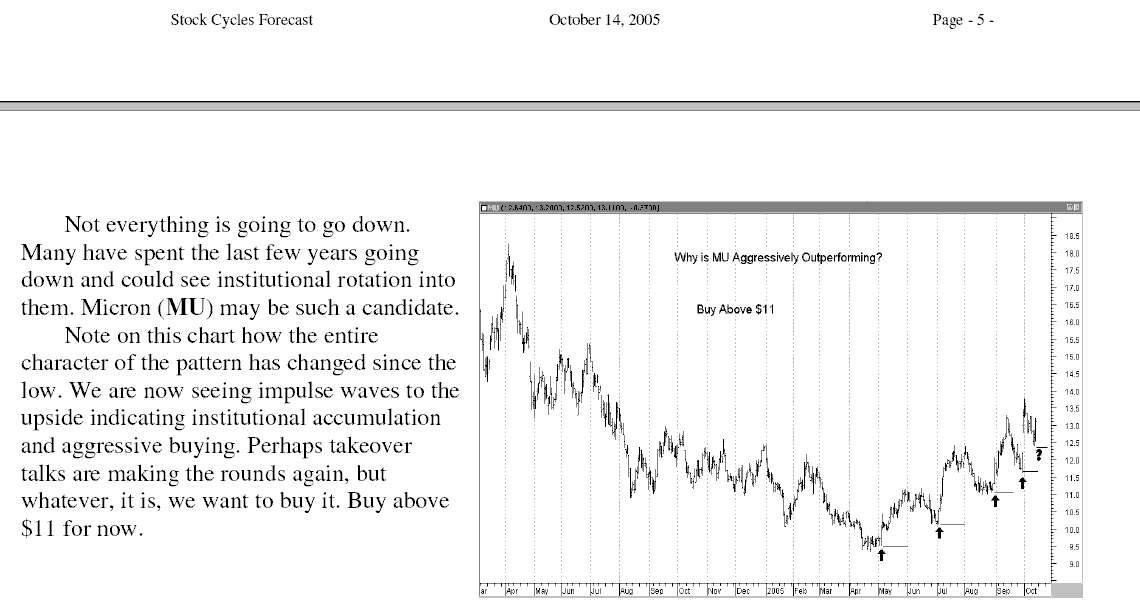
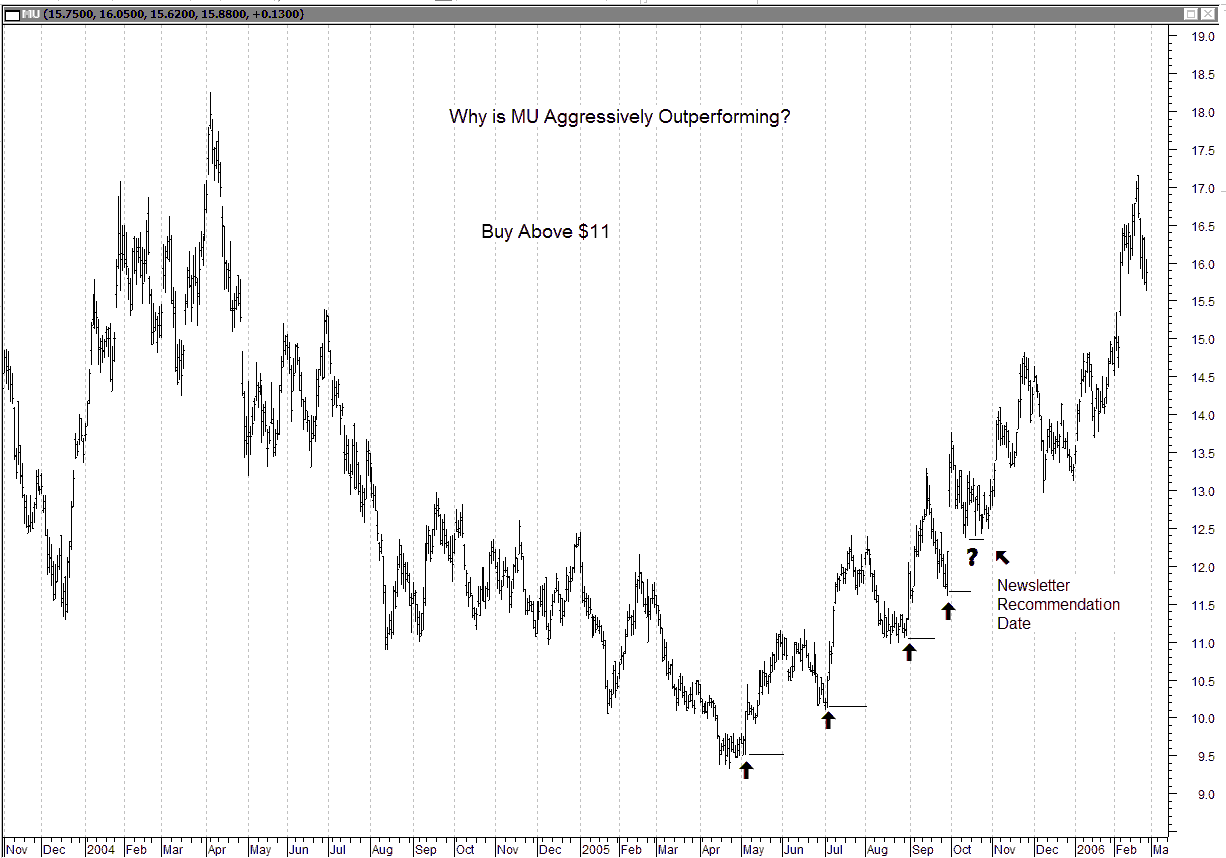
Having come from a background of Bank Trust Department Portfolio Manager, Mutual Fund Manager, and Specialist Firm Day Trader, I have a great familiarity with the markets and chart reading in particular. I usually can spot a big winner early in the game and often hightlight them in the newsletter. Micron was an old favorite before the year 2000 bear market and recent activity shows a bullish development. I hightlighted the stock for buying in the October 2005 letter when it was $12-$13. Four months later it crossed $17- a 30% to 40% gain.
The Stock Cycles Forecast newletter has an annual subscription rate of $500 for the letter including the nightly telephone update. There is also a six months rate of $265 with the nightly update if you choose. If you do not desire to have the nightly telephone option you can subscribe to the letter alone for one year for $300. There is also a 2-issue trial to the letter alone for $50. It should be noted that all subscriptions have a 'pro rata' refund feature so you can cancell at any time and get a refund for the unused portion of your subscription pro rated on a daily basis.The usual delivery of the newsletter is via email but regular mail is also possible if preferred.
Click Here For A Free Sample Letter! Sample Letter- Oct 2012
Click Here For The July 2007 Top Prediction Letter!