Archives - Stock Cycles Forecast Past Newsletters
The final market top was predicted in June and July 1987 for August 24th, and I pounded the table in August about the impending top. I also pointed out that the long term bull market for an individual stock- Merck- was due to end the first week of September- which it did. | |
 I saw in October a parabolic collapse coming that could be 500 points and might end on the expected low date of October 19th- the exact low of the 500 point down day! | |
 In mid June 1989 I made a series of predictions about the future which all came out exactly as predicted pointing out the value of cycles and disproving for all time the notion the "no one can predict the market" | |
 In September 2002 I not only predicted the end of the bear market for the first week of October 2002 but also stated that there would very likely be another 'final' low near March 12th the next year- that was the exact final low day! | |
 Many issues have teaching lessons to help you do it yourself and here I explained how the Square of Nine can be used to predict the future and this example calculated the exact May top 43 months from the low, as well as the top price! | |
 I also showed a second method to calculate the top price giving more weight to the prediction and helping you to learn how to do it yourself | |
 This was the result of the prediction- time and price nearly perfect. | |
 In July 2007 I was warning of the coming collapse and financial panic and specifically pointed out that it would be the result of the sub prime mortages and over concentration in these and derivatives- this was long before the Lehman collapse- 1 year later- which could have been prevented | |
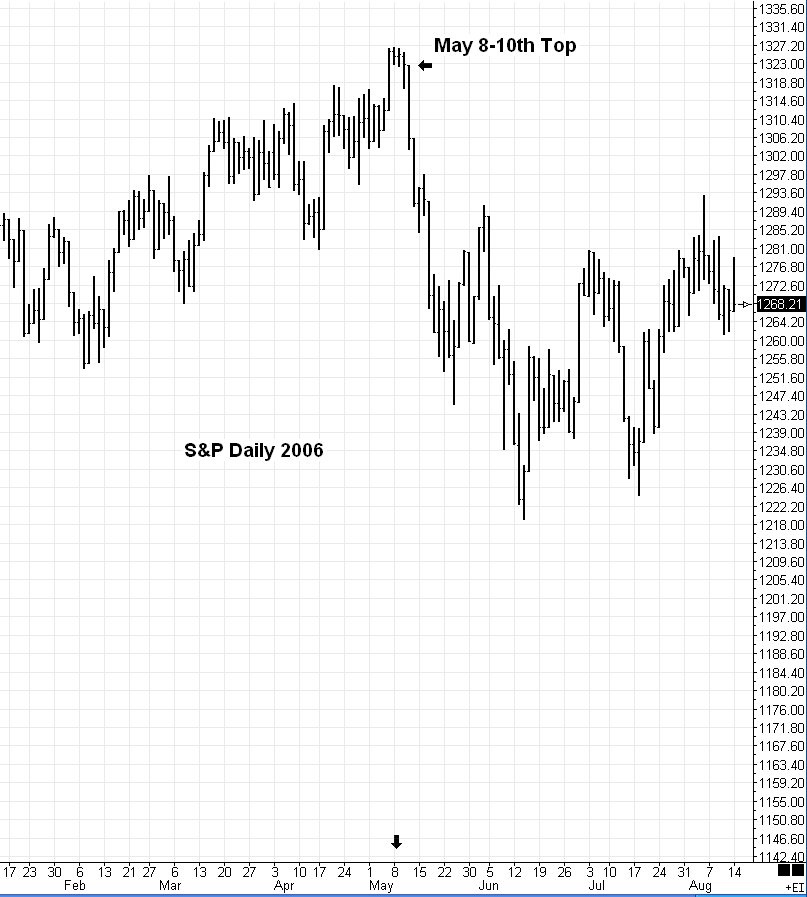
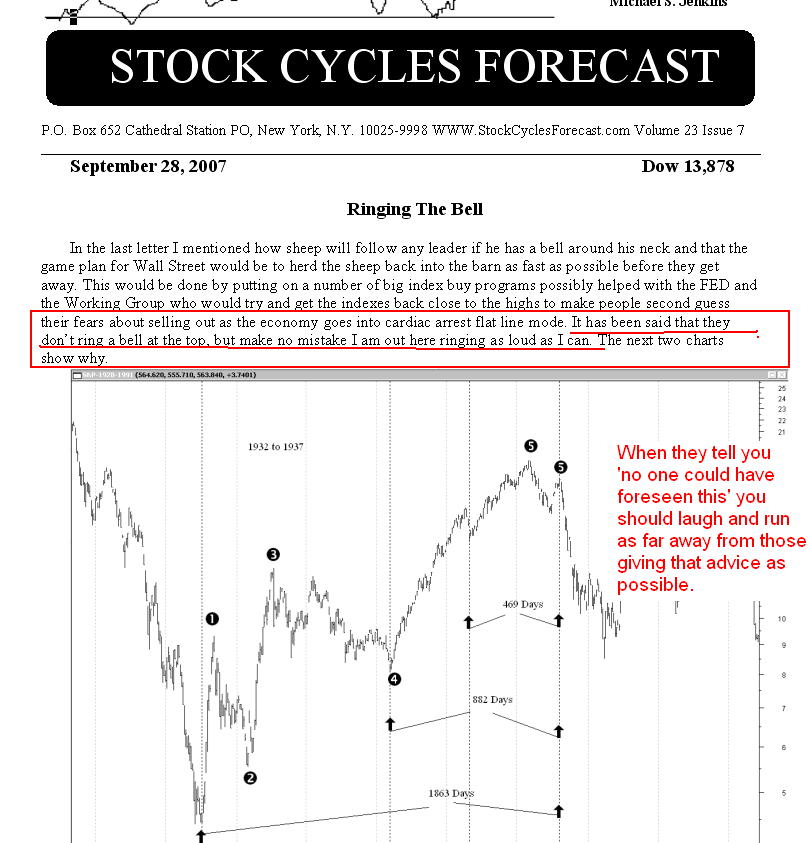 The second top in 2007 gave me another chance to issue a strong warning and a chart that would show exactly what would happen, giving you plenty of time to save your life savings before the coming wipeout of all the brokerage firms. Do you STILL think the market can't be predicted? | |
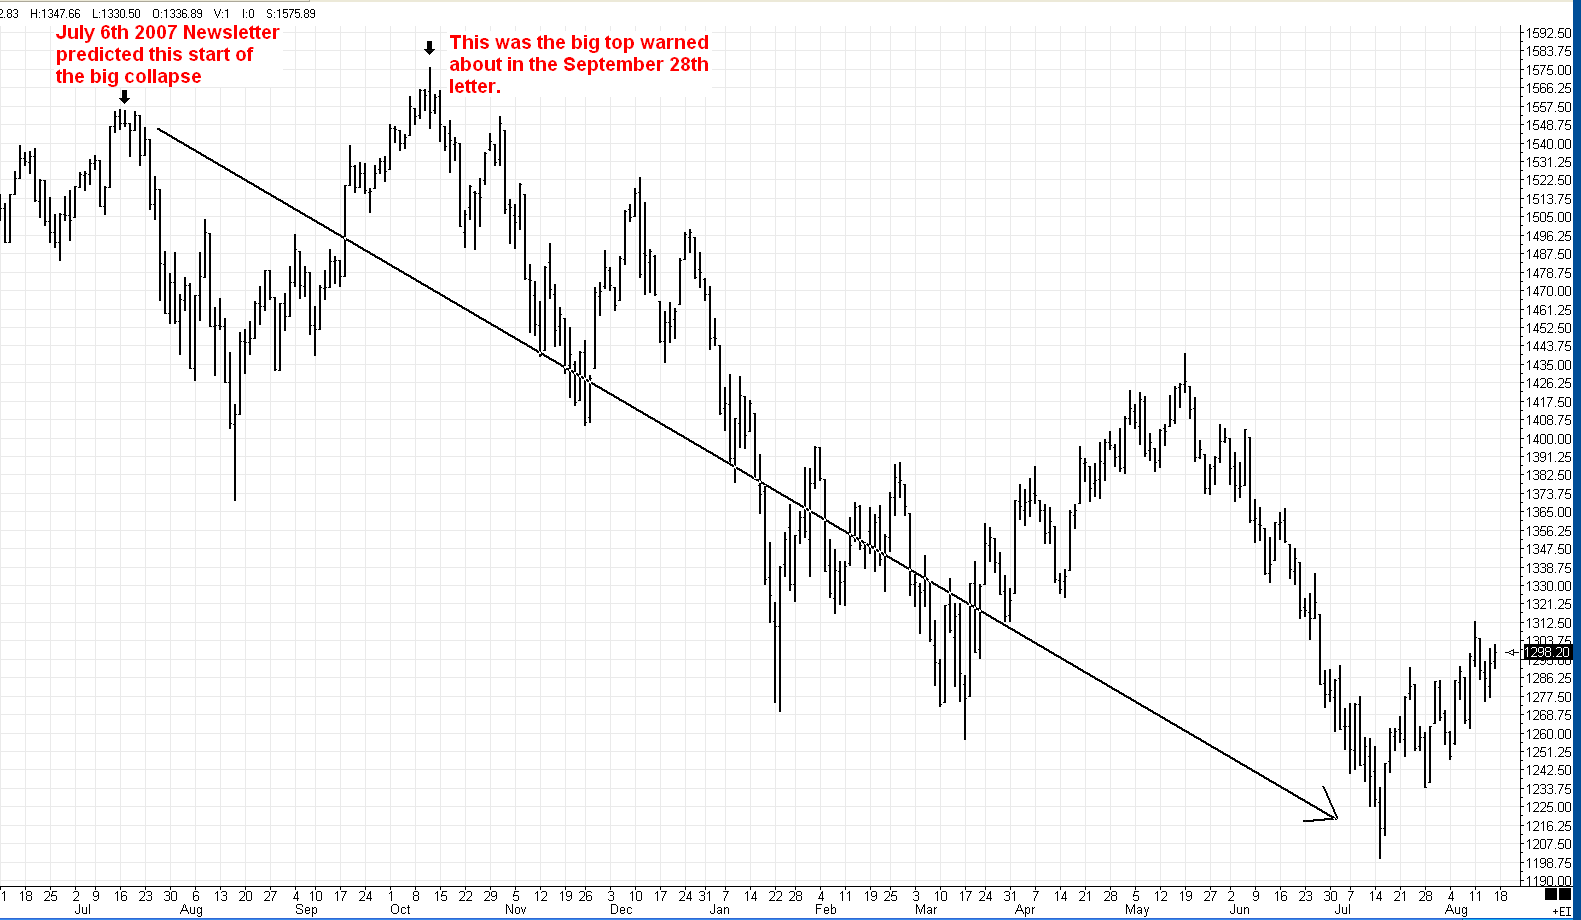 This is a chart of the resulting next year following my warnings. | |
 During the collapse and ensuing bear market, I successfully called the many tradeable lows and intermeadiate tops. | |
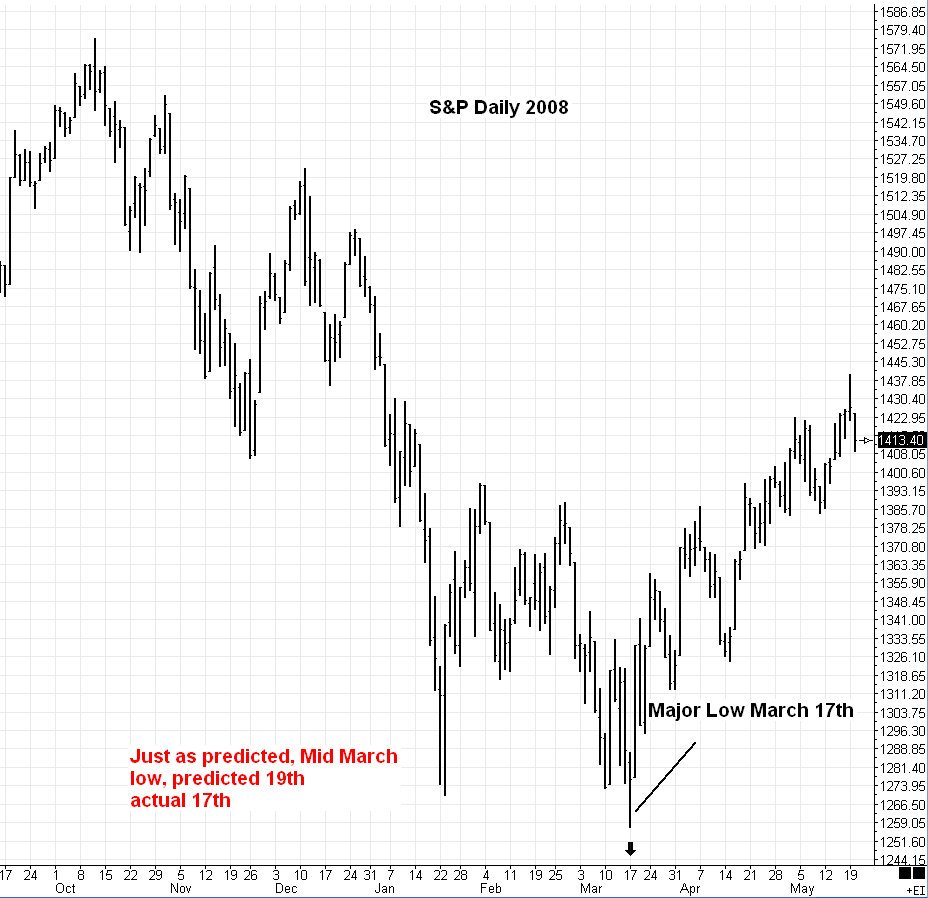 Once again the predicted low came in as scheduled | |
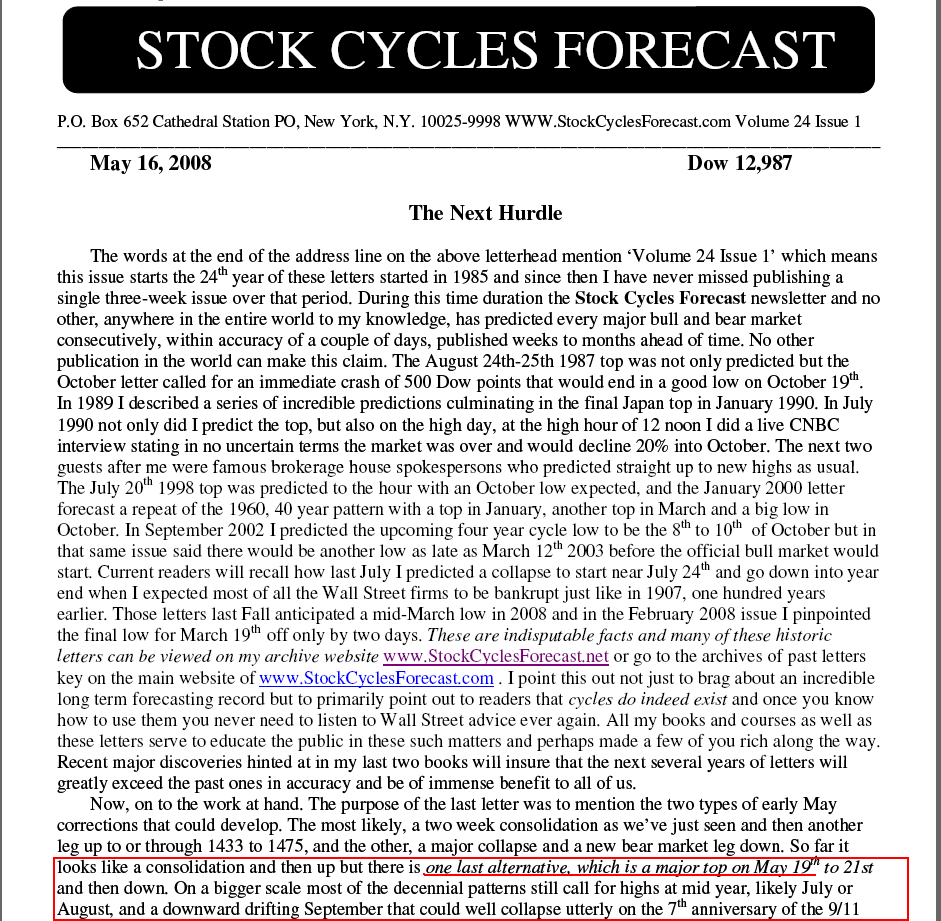 The next top was tricky but I explained how each of the small subcycles pointed to a potendial major top on May 19th | |
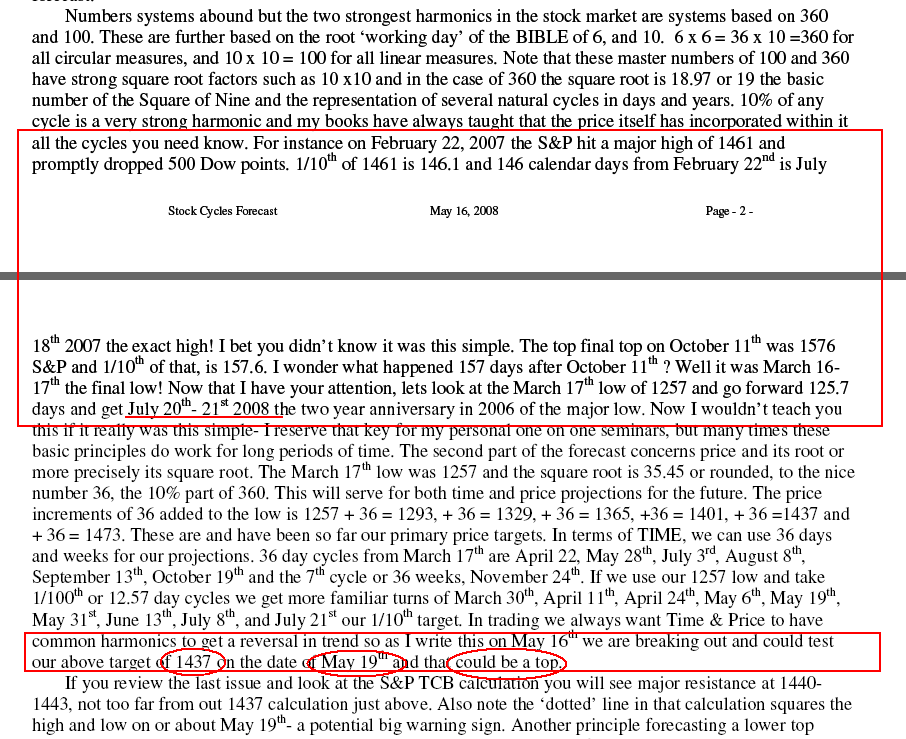 I taught you here how to do the analysis and what dates to watch for to confirm the coming top to be prepared to take action on that date. | |
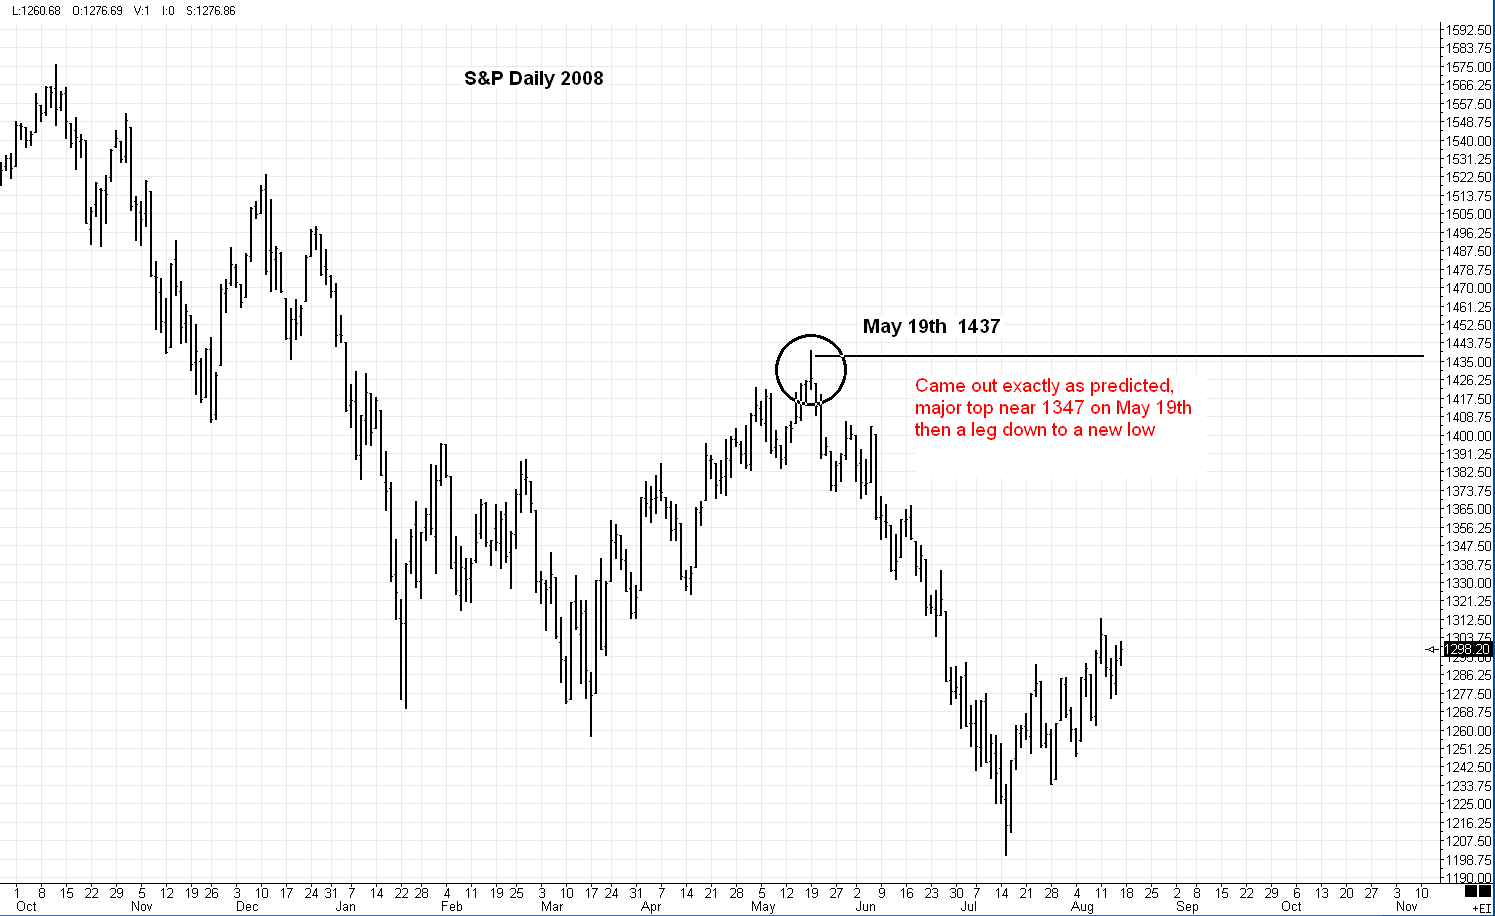 Another prediction which came true with the exact date and price forecast! | |
 The FINAL low on March 6th 2009 was suggested in my newsletter of that date and while I was not sure that there would not be another test of the lows after a three to six month rally, it was a good warning to stop shorting and think about doing a little buying for the first time since 2007. | |
 Not all forecasts are perfect but most almost always have a 'hint' of coming themes. This was a warning about a cycle from the panic of 1890 and a week after this forecast we had the so called 'flash crash' where the Dow jones dropped 1000 points in a single day. While the 'excuse' was computer programs, the 'trigger' was the past cycle warned about in the letter as the market was technically vulnerable to such an event. In this business we always say 'the news breaks with the cycle' meaning the historical events always recur even if not exactly the same in every detail. | |
 In April 2011 I demonstrated how cycles tell you where they are coming from by their prices and in this example I pointed back to the 2007 top which was repeating almost exactly and in this case gave rise to a collapse low on October 4th, 2011 almost exactly 4 years from the October 2007 top. | |
 This chart is admitedly distorted to get it to fit in most browsers but it was a demonstration of the balancing of time and price with circular arcs. Here I was explaining how a major high would be seen on April 29th and another on May 13th. The April 29th date was the high close for the year even with the announcement of the Bin Laden death the next day (opened way up but closed down). This same chart was also suggesting the final top would ocurr in 2013. | |
 This was the outcome of the circular arc top due on April 29th. In that letter I was expecting an oversold rally into early July and that was the case that led to a 'panic' in late July with the collapse down to October. | |
 Here in late June I suggested that the re-weightings selling at the end of June would lift giving rise to a relief rally into early July. | |
 In the early July letter I described a collapse pattern from the four year cycle from 2007 and you can see the actual outcome. | |
 Here's the actual panic outcome from the forecast that could have made you a lot of money selling short or buying puts, or just avoiding the big losses all the institutions incurred. | |
 In this letter I predicted the final top for gold to be August 24th and a price near 1880. It was another perfect call and the secondary top on September 6th was mentioned on the telephone update. Recently in July 2011 I recommended gold near $1175 and subsequently sold the $1400+ bear market rally | |
 The same arc analysis that predicted the final top for April 29th also had an October 7th prediction in it and the low for the year was October 4th. | |
 The newsletter often has a "Traders Tip" section, and in this one I demonstrated how the Square of Nine predicted both the date and price for the October 4th 2011 low and that same pattern now called for a top. | |
 This is the top predicted in that October 28th newsletter and the significant decline that followed. | |
 One of the best trading magazines is 'Your Trading Edge' from Australia and I sometimes write articles for them. In this article I demonstrated before hand how to predict the date and price of the coming top- I predicted it in the article within one day and 1 S&P point. | |
 This was the chart shown in the article with the 'red rectangle' the target to as late as April 2nd and a price of 1420- Actual top- April 2nd and price high 1422 with close 1419 | |
 Here's how that forecast came out- not bad for a 'public' magazine forecast made in real time (note the date at the bottom of the prior chart where the 'bars' were still in late February when the forecast was made and submitted to the magazine) | |
 Initially I thought that forecast would be the high for the year but in my June letter I said that if the last week in June saw prices still near the 1320 area than a higher high would be made in the fall and that high was to be 1468 which was the exact high tick on the current futures for the year (although the cash market high was 1474). In this early September letter with the market at 1419 note that my primary target circled on the front page was 1468. | |
 Here's the same chart a few weeks later showing the exact high hit and the start of the big break down into November. | |
 Most people never realize that all the future highs and lows are incorporated in the initial 'bar' of a movement- this is one of the Gann secrets only taught in my seminars- but here I demonstrated how after the IPO of Facebook the most likely low would be $17. That turned out to be the exact final low. | |
 Here's a good example of my 'Traders Tips' in the newsletter which show you how to calculate all the key cycles by yourself. In this case I demonstrated how my Jenkins Natural Ratios and Jenkins True Trend Lines from my Secret Science book can be used to get all the exact timing harmonics in any market ('arrow' turning points) | |
 This is another application of my JTTL method of time cycles showing how to get all the dates from a single high. | |
| Orders can be mailed to: Stock Cycles Forecast P.O. Box 652 Cathedral Sta PO New York, N.Y. 10025-9998 ... Six months newsletter with Daily telephone update $265 ... Full year newsletter with daily telephone update $500... Full year subscription without daily telephone update $300... Two Issue Trial to newsletter without telephone update $50...Chart Reading book $75 ... Geometry book $50 ... Secret Science Book $135...Basic Day Trading Techniques $125...Complete Trading and Forecasting Course $529 ($550 non-US), The Secret Angle Method $500... Square The Range Trading System $325...one hour MTA (Market Technicians Assn) video plus slide show, $30 non-US, or $20 US...the BEST DEAL ever, explains many secret methods in detail. Stock Trading Using Planetary Time Cycles - The Gann method Vol I $425 and Vol II $400- Vol I MUST be bought since it contains necessary software needed for both volumes- if bought as a two volume set the price is $700.
Credit card orders are made through PayPal on the web (www.paypal.com) To use PayPal (it's free to use and you can get a free account) just go to their website and instruct them to send the money in US funds to Michael S. Jenkins, with the email address of: mjenkins@stockcyclesforecast.com
You can also mail a check to:
Stock Cycles Forecast
P.O. Box 652 Cathedral STA PO
New York, N.Y. 10025-9998 | What is the 'Hotwire' or Telephone Update Service?
This is a password protected phone in service that comes with the 6 month or 1 year subscriptions and connects you to a computer answering machine that goes on each night at 5-6 PM and stays on 24 hours until the next message. While it is a NY phone extension, it can be accessed with 'Skype' type internet phones so charges are minimal. Each night I update the outlook on the market with support and resistance numbers on the S&P, Bonds, the Dollar, gold, oil and about a dozen stocks due cyclic turns the next day as well as arbitrage programs working the Street. |
Return to Home Page